About

Ahead of the Curve provides you with analysis and insight into today's global financial markets. The latest news and views from global stock, bond, commodity and FOREX markets are discussed. Rajveer Rawlin is a PhD and received his MBA in finance from the Cardiff Metropolitan University, Wales, UK. He is an avid market watcher having followed capital markets in the US and India since 1993. His research interests includes areas of Capital Markets, Banking, Investment Analysis and Portfolio Management and has over 20 years of experience in the above areas covering the US and Indian Markets. He has several publications in the above areas. The views expressed here are his own and should not be construed as advice to buy or sell securities.

Featured post

Time Series Analysis with GRETL

This video shows key time-series analyses techniques such as ARIMA, Granger Causality, Co-integration, and VECM performed via GRETL. Key dia...

Wednesday 28 October 2015

Interesting Market News and Views from Global Financial Markets-4

1) S&P 500 back in black for 2015, Nasdaq leaps 2.3% - USA TODAY

Tech stocks power the rally on strong earnings from Microsoft, Amazon.com, Alphabet."

2) Bear Market History: The 10 Biggest S&P 500 Pullbacks - Money Morning

There are multiple signs pointing to a bear market in 2015. That's why we've compiled a list of the 10 worst drops in bear market history."


3) What's Really Driving the Stock Market's Big Rebound Rally? - The Fiscal Times

A combination of solid earnings (especially in tech) — as well as a fresh interest rat"

4) The S&P 500 is up an impressive 0% this year - Business Insider

Stocks, emerging market FX, and oil are well off their lows."

5) Techs lead Wall St. higher; S&P 500 erases 2015 loss - Reuters

A tech share rally drove U.S. stocks up sharply for a second day on Friday as earnings from companies including Microsoft beat analysts' expectations, while healthcare shares rebounded from recent losses."

6) What If The US Is Japan And Deflation Is Fate? - Seeking Alpha

Make no mistake about it – while we can talk about daily market movement and the news du jour, the reality is we live in a very small sample. The biggest macro"


Sunday 25 October 2015

Market Signals for the US stock market S and P 500 Index and Indian Stock Market Nifty Index for the Week beginning October 26

Indicator
Weekly Level / Change / Significance
Implication for
S & P 500
Implication for Nifty*
S & P 500
2075, 2.07%
Bullish
Bullish
Nifty
8296, 0.70%
Neutral**
Bullish
China Shanghai Index
3412, 0.62%
Bullish
Bullish
Gold
1164, -1.14%
Bearish
Bearish
WTIC Crude
44.73, -6.29%
Bearish
Bearish
Copper
2.35, -2.21%
Bearish
Bearish
Baltic Dry Index
774, 2.65%
Bullish
Bullish
Euro
1.1015, -3.02%
Bearish
Bearish
Dollar/Yen
121.46, 1.65%
Bullish
Bullish
Dow Transports
8296, 2.69%
Bullish
Bullish
US 10 year Bond Yield
2.08%, 2.97%
Bearish
Bearish
Nyse Summation Index
373, 99.09%
Bullish
Neutral
US Vix
14.46, -3.92%
Bullish
Bullish
20 DMA, S and P 500
1992, Above
Bullish
Neutral
50 DMA, S and P 500
1980, Above
Bullish
Neutral
200 DMA, S and P 500
2060, Above
Bullish
Neutral
20 DMA, Nifty
8095, Above
Neutral
Bullish
50 DMA, Nifty
8042, Above
Neutral
Bullish
200 DMA, Nifty
8377, Below
Neutral
Bearish
India Vix
16.19, -0.51%
Neutral
Bullish
Dollar/Rupee
65.01, 0.47%
Neutral
Neutral


Overall
 S & P 500
Nifty

Bullish Indications
9
10

Bearish Indications
5
6

Outlook
Bullish
Bullish

Observation
The Sand P 500 and the Nifty were up last week. Indicators are bullish. The Vix is back in complacency mode. Looking for a top post the FOMC.


On the Horizon
 Australia - CPI, New Zealand – Rate decision, Canada - GDP, Euro Zone – German employment data, German CPI, Euro Zone CPI, U.K – GDP, Japan - CPI , U.S – Durable goods, Consumer confidence, Trade balance, personal consumption, GDP, FOMC rate decision.


*Nifty
India’s Benchmark Stock Market Index


Raw Data
Courtesy Google finance, Stock charts, FXCM


**Neutral
Changes less than 0.5% are considered neutral


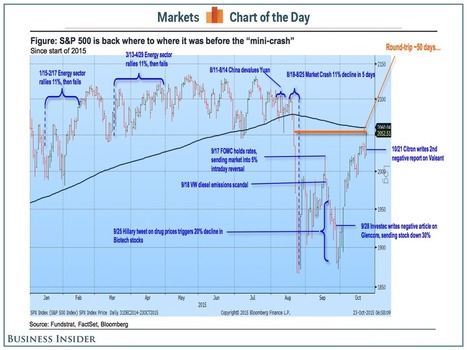
The markets rallied last week. Signals are bullish for the upcoming week and this bounce is on the verge of completion. The tape has been very strong the last few days and downside momentum must be confirmed below 2050 for short positions. The markets should encounter resistance at higher levels post the FOMC meeting. There will be more downside upcoming in the #Nifty and the S and P 500, with at least a retest of the lows for the S and P 500 near 1867 and Nifty near 7550 in the upcoming months. You can check out last weeks report for a comparison. You can also check out snapshots of the S and P 500 and Nifty Indices. Love your thoughts and feedback.

Thursday 22 October 2015

Support and Resistance Levels for the US Stock Market S & P 500 and the Indian Stock Market Nifty Index

Stock Market News

Amazon Deals

World Indices


Live World Indices are powered by Investing.com

Market Insight

My Favorite Books

  • The Intelligent Investor
  • Liars Poker
  • One up on Wall Street
  • Beating the Street
  • Remniscience of a stock operator

See Our Pins

Trading Ideas

Forex Insight

Economic Calendar

Economic Calendar >> Add to your site

India Market Insight

My Asset Allocation Strategy (Indian Market)

Cash - 40%
Bonds - 20%
Fixed deposit - 20%
Gold - 5%
Stocks - 10% ( Majority of this in dividend funds)
Other Asset Classes - 5%

My belief is that stocks are relatively overvalued compared to bonds and attractive buying opportunities can come along after 1-2 years. In a deflationary scenario no asset class does well other than U.S bonds, the U.S dollar and the Japanese yen, so better to be safe than sorry with high quality government bonds and fixed deposits. Cash is the king always. Of course this varies with the person's age.